Ethernet RX/TX — 12-hour Bandwidth Graph
Open live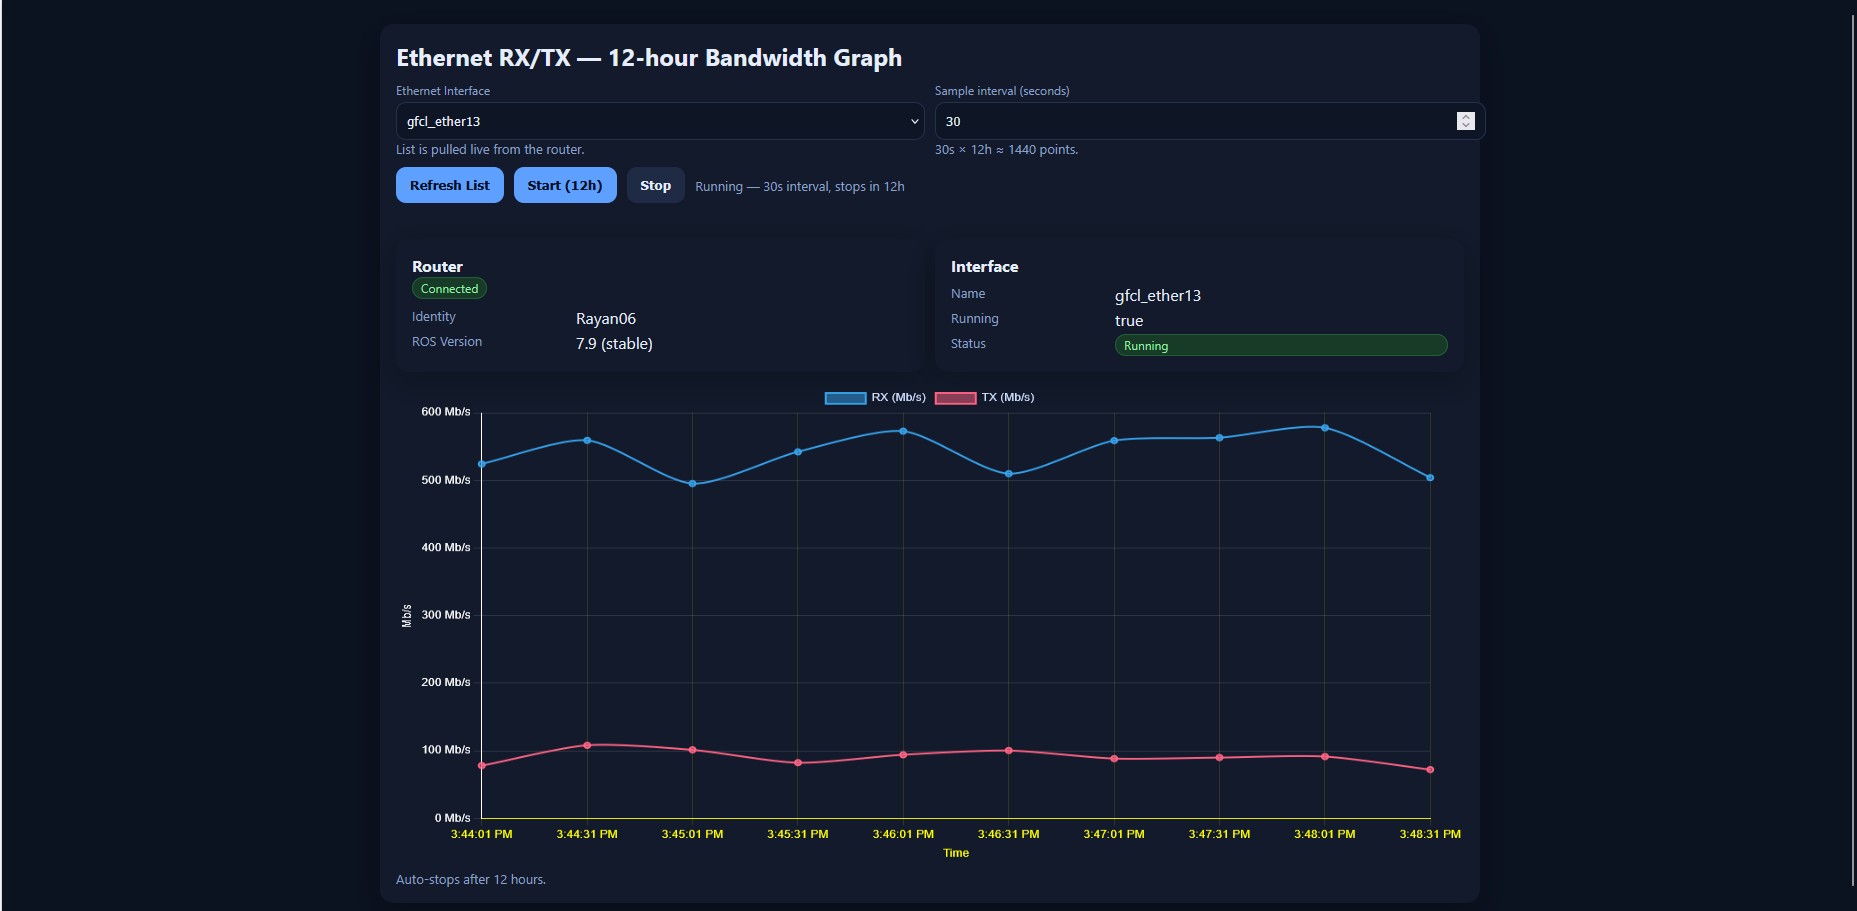
Connected
Interface
Example:
gfcl_ether13Sample interval
30s (configurable)
Window
12 hours (auto-stop)
Router identity
Rayan06
ROS version
7.9 (stable)
Status
Running
Use this to monitor uplink/load on any Ethernet port for capacity planning and anomaly detection.
Active PPPoE Users — 12-Hour Graph
Open live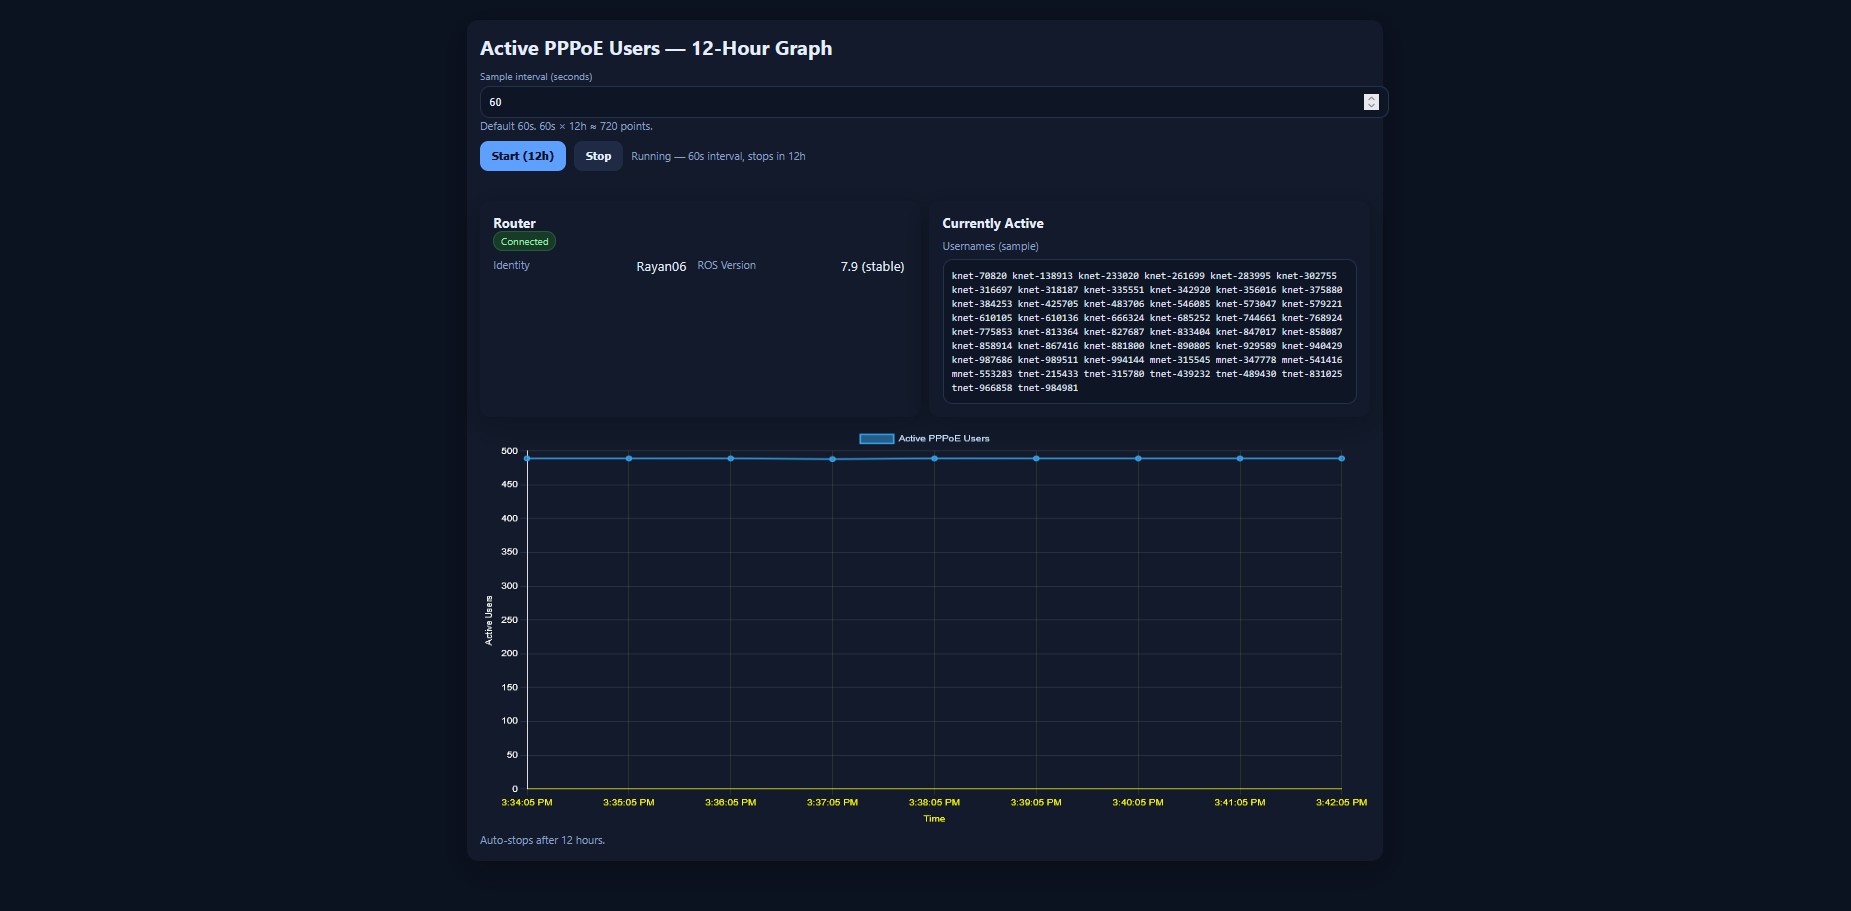
Connected
Metric
Concurrent active PPPoE users
Sample interval
60s (configurable)
Window
12 hours (auto-stop)
Router identity
Rayan06
ROS version
7.9 (stable)
User list
Shows a rotating sample (up to 50) of active usernames
Ideal for seeing busy hours, capacity trends, and detecting abnormal login spikes.
PPPoE Per-User RX/TX — 5-Minute Graph
Open live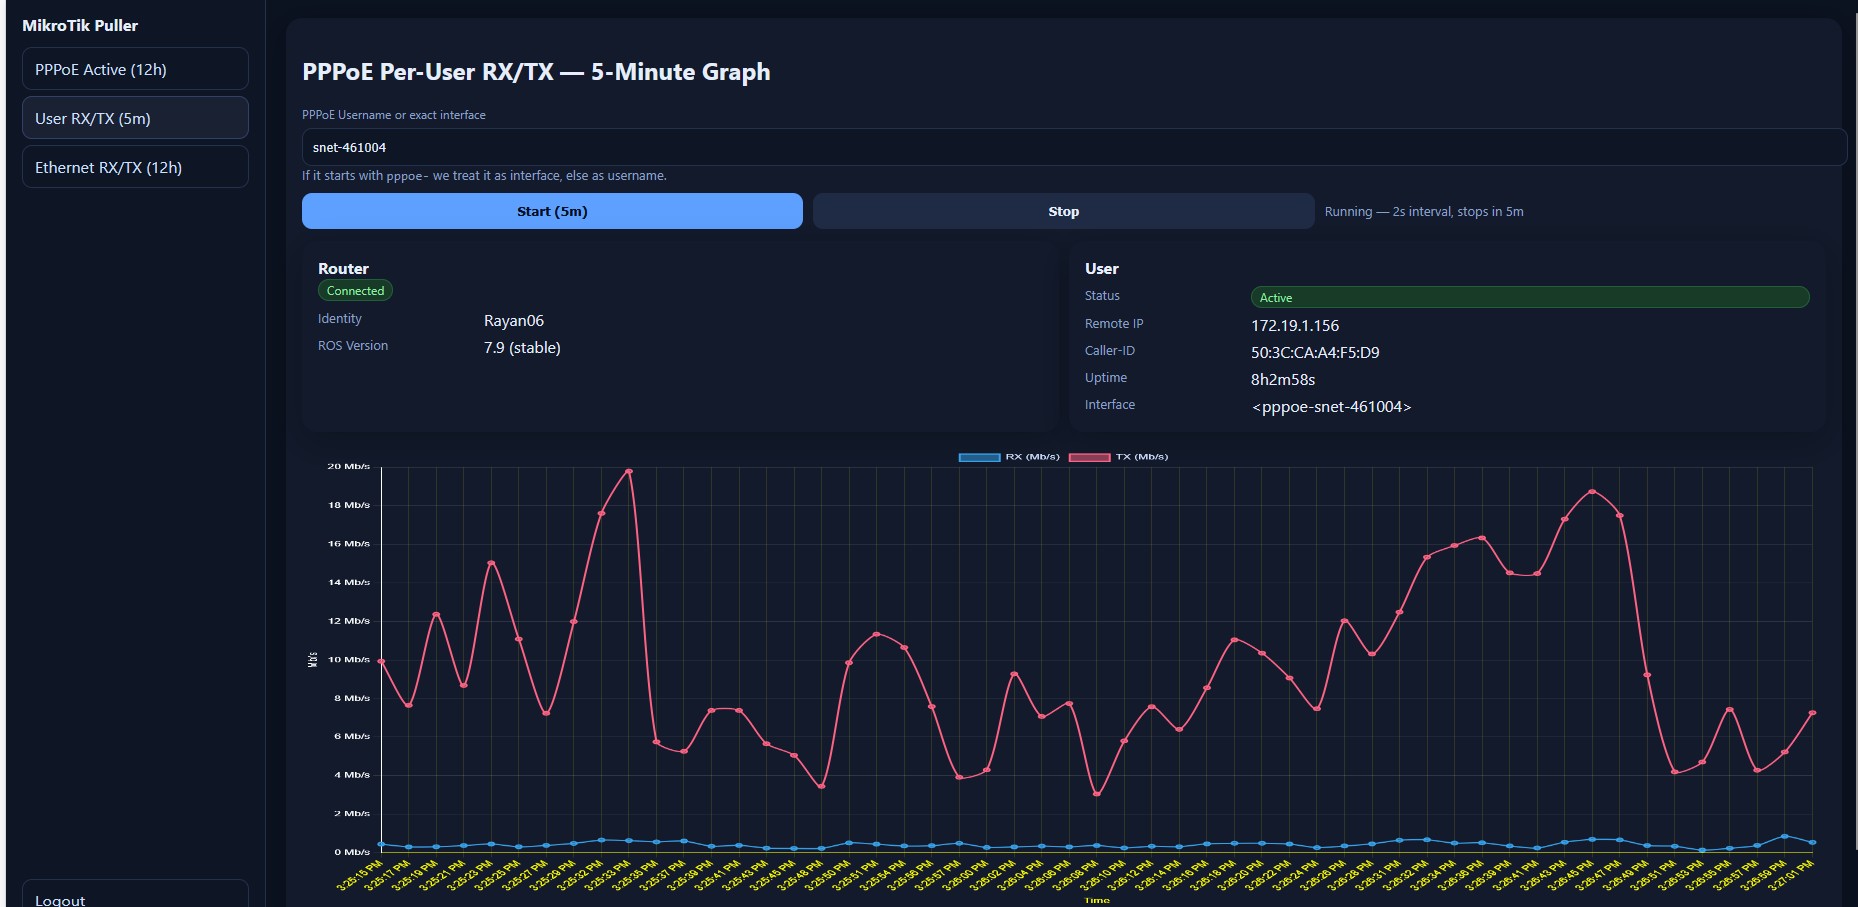
knet-108378) or an exact interface.Status
Active
Remote IP
e.g.
172.19.1.156Caller-ID (CPE MAC)
e.g.
50:3C:CA:A4:F5:D9Uptime
e.g.
8h 2m 58sInterface
e.g.
<pppoe-snet-461004>Poll rate
Every 2 seconds (auto-stops after 5 minutes)
Use this to troubleshoot single customers, verify shaping, and visualize bursts.